雅思写作Task1柱状图类型作文范文(7)
认真研读一定的雅思范文及作文模板可以帮助我们检验自己的写作水平,并能很好地吸收和应用优秀范文里的优秀内容~更多雅思备考资料,请持续关注新东方雅思栏目。
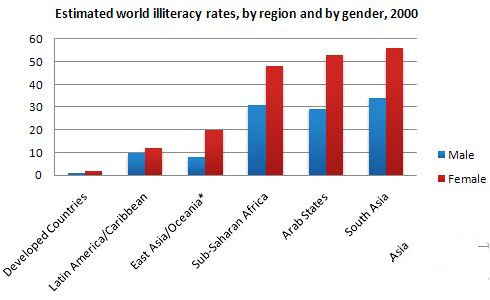
The chart below shows estimated world illiteracy rates by region and by gender for the year 2000.
Write a report for a university lecturer describing the information below.
Sample Answer:
The given bar chart shows the approximate world illiteracy rates by gender and region for the year 2000. As is observed in the given column graph, in all cased, the illiteracy rate among women is higher than men. Developed countries have almost ignorable illiteracy rate and in the contrary, about half of the population in south Asia, Arab states and Africa are illiterate.
The illiteracy rate in Latin America / Caribbean and East Asia / Oceania is only 1 percent (approximately), 10 percent and 14 percent (approximately) respectively considering both male and female. Sub-Saharan Africa, the Arab States and South Asia had rates of approximately 40%, 41% and 45%. Illiterate women are higher than the illiterate men in all the given countries.
In the developed countries, the proportion of literacy among men and female is almost similar but the differences increased for Asia, Arab states and Africa. Among the given 6 countries, South Asian population are far more illiterate than any other country.
(Approximately 163 words)
(This model answer can be followed as an example of a very good answer. However, please note that this is just one example out of many possible approaches.)
经营许可证编号:
京ICP备05067667号-32 | 京ICP证060601号|
京网文(2016)5762-750号 |
 京公网安备11010802021790号
Copyright 2011-2026 新东方教育科技集团有限公司, All Rights Reserved
新媒体平台资质审核电话:010-60908000-8941

认真研读一定的雅思范文及作文模板可以帮助我们检验自己的写作水平,并能很好地吸收和应用优秀范文里的优秀内容~更多雅思备考资料,请持续关注新东方雅思栏目。
The chart below shows estimated world illiteracy rates by region and by gender for the year 2000.
Write a report for a university lecturer describing the information below.
Sample Answer:
The given bar chart shows the approximate world illiteracy rates by gender and region for the year 2000. As is observed in the given column graph, in all cased, the illiteracy rate among women is higher than men. Developed countries have almost ignorable illiteracy rate and in the contrary, about half of the population in south Asia, Arab states and Africa are illiterate.
The illiteracy rate in Latin America / Caribbean and East Asia / Oceania is only 1 percent (approximately), 10 percent and 14 percent (approximately) respectively considering both male and female. Sub-Saharan Africa, the Arab States and South Asia had rates of approximately 40%, 41% and 45%. Illiterate women are higher than the illiterate men in all the given countries.
In the developed countries, the proportion of literacy among men and female is almost similar but the differences increased for Asia, Arab states and Africa. Among the given 6 countries, South Asian population are far more illiterate than any other country.
(Approximately 163 words)
(This model answer can be followed as an example of a very good answer. However, please note that this is just one example out of many possible approaches.)


 @高三生,高考复习我有这些建议...
 @高三生,高考复习我有这些建议...

